This guide takes you through your first steps with ImageC, helping you create your first ImageC project and start analyzing images.
Tip Please read Installation first and run ImageC on your computer before starting with this tutorial.
After download the correct ImageC bundle for your computer, unzip the downloaded data and use the imagec for Linux and macOS resp. imagec.exe for Windows to start ImageC.
The start page will be shown once ImageC is successfully launched.
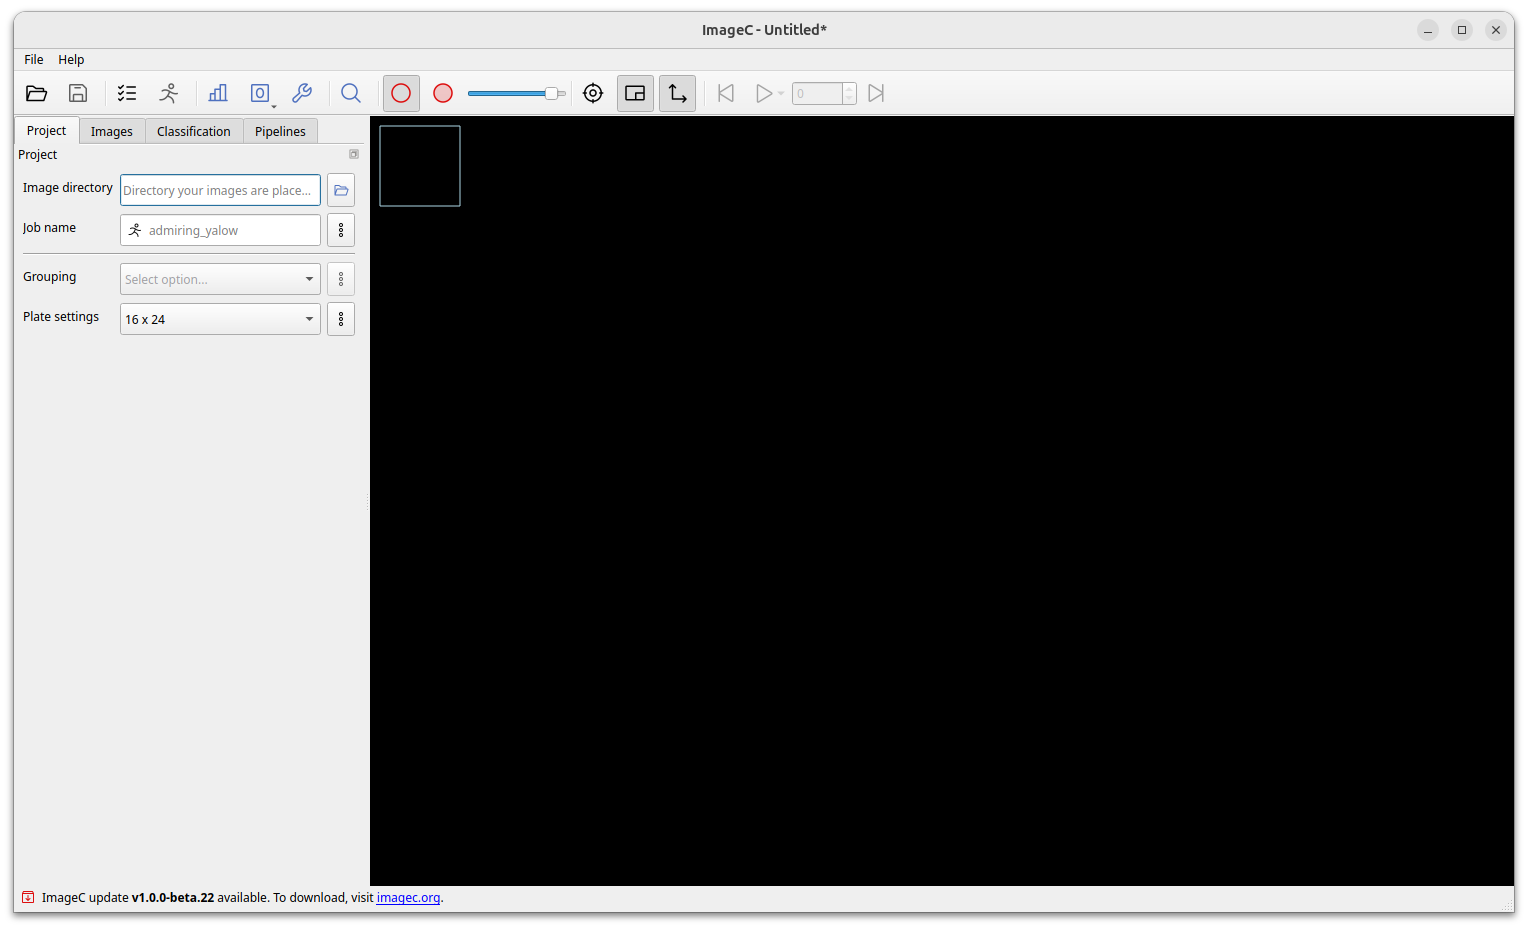
The tabs in the navigation pane on the left hand side are used to enter basic settings.
Navigate from the left Project tab over the Image to the Classification tab.
Once all settings in these tabs are done, you can start creating image processing pipelines in the Pipeline tab.
Project
Starting with the project settings, basic information about the experiment and the used image setting must be done.
| Title | Description | Mandatory |
|---|---|---|
| Image directory | Storage Directory of the images to be analyzed. | x |
| Job name | Name of the job to identify the run (auto generated if empty). | x |
| Grouping | Images may be left ungrouped, or can be grouped by Filename regex or Directory. | x |
| Plate size | Size of the uses microscopy plate. Open the plate settings dialog to define the well order. | x |
Image Grouping
When grouping by Foldername or Filename is selected ImageC will group the images based on these settings, displays the images grouped by Well in the results and calculates the statistics based on the determined group.
Filename grouping uses regex (regular expressions) to extract the position on the plate and the position of the image in the well from the image filename.
Extracted are: plate row and column position and the image index in the well.
A change of the grouping settings after analysis is currently not supported by ImageC. If the grouping settings are changed the analysis has to be repeated.
Warning Make sure that the grouping options and regex settings are correct, as they are needed for valid image sorting and mean well infos. However, if the grouping settings are wrong, these statistics will also be calculated in a wrong way.
To extract the well position using regex from the filename correct, it es expected that the row position in the filename is a character in the range of
[A-Z]and the column and index a decimal number. A typical series of file names for the regex {regexp}_((.)([0-9]+))_([0-9]+)might look something like the following:
name_A1_1.tifname_A1_2.tifname_A1_3.tifname_A1_4.tifname_A2_1.tifname_A2_2.tifname_A2_3.tifname_A2_4.tifTo experiment with regular expressions, have a look at regex101.

Image directory
The Image Directory should be set to the folder where the images to be analyzed are stored.
ImageC will perform a recursive folder search using the selected Image Directory as the base folder to find all supported image files.
All found files are listed in the Images panel.
Tip See section Images for a full list of all supported image formats.
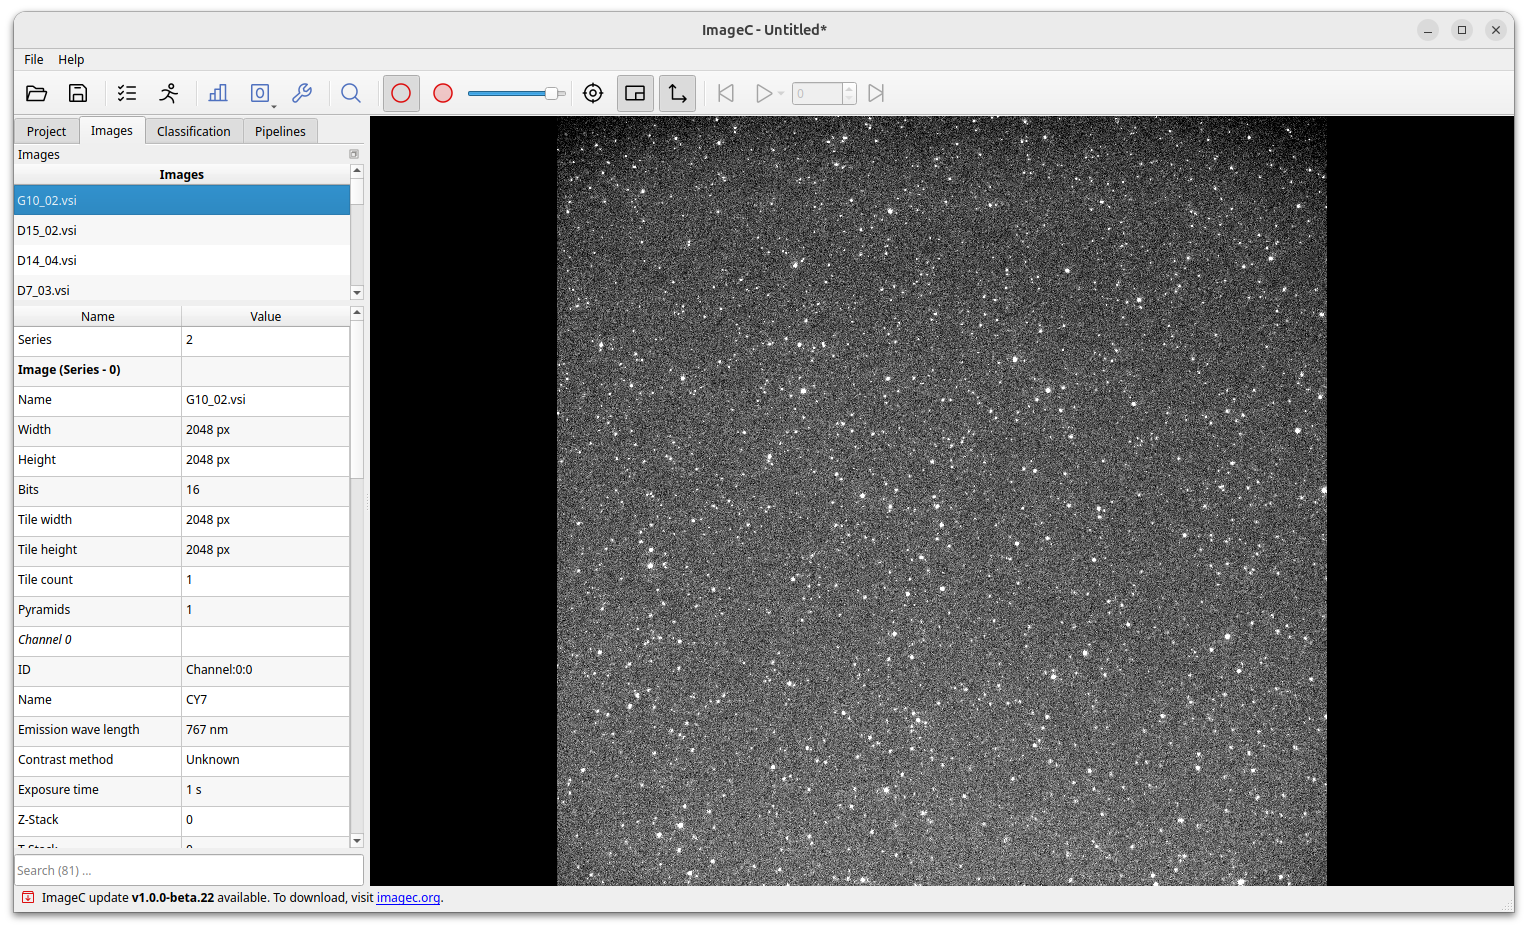
Images
Once a image directory has been selected and the folder scan is complete, all the images found will be listed in the table located in the Images tab.
By clicking on an image the image meta information of the selected image is loaded and displayed in the properties table below. The image selected in this tab is also the image used in the pipeline preview.
To the top a search field allows to filter the images in the list against its filename.
Classification
First before creating pipelines and starting the analysis the object classes must be defined.
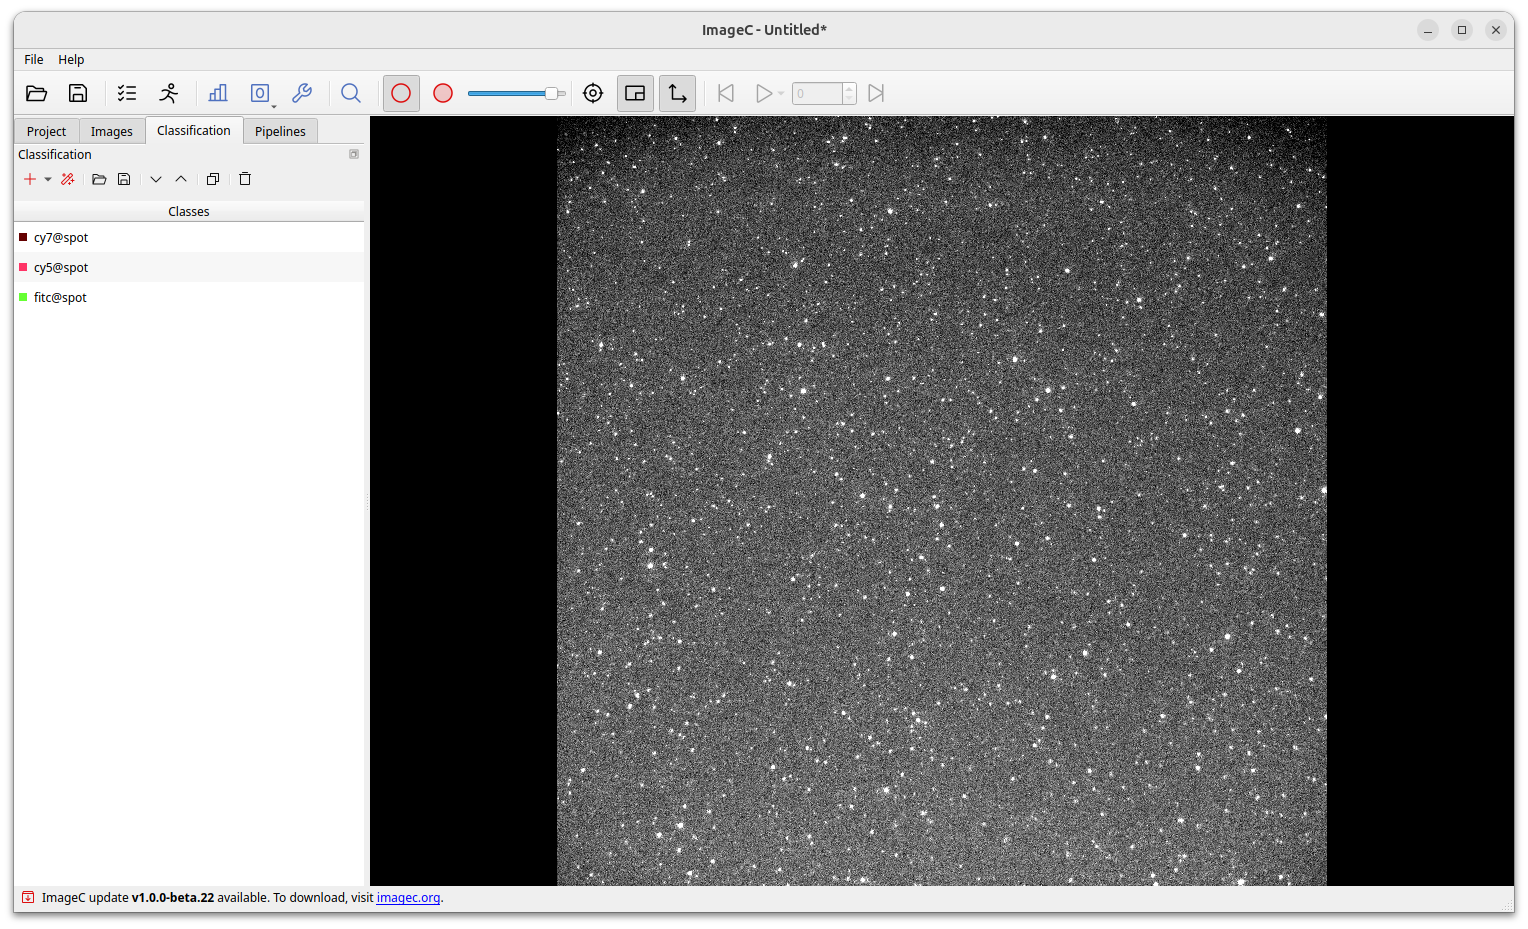
A separate object class must be defined for each different object type and population to be extracted from the images.
Example object classes might be: dapi@nucleus, cy7@spot, cy5@spot, coloc@cy7cy5.
ImageC allows to either define your own classes, load a preset of classes from a template or try to automatically populate classes, using the magic stick button, based on the image meta data and channels.
Tip Class names can consist of two parts, separated by an
@. The first part is used to sort the classes in the drop down boxes to help you keep track of them.
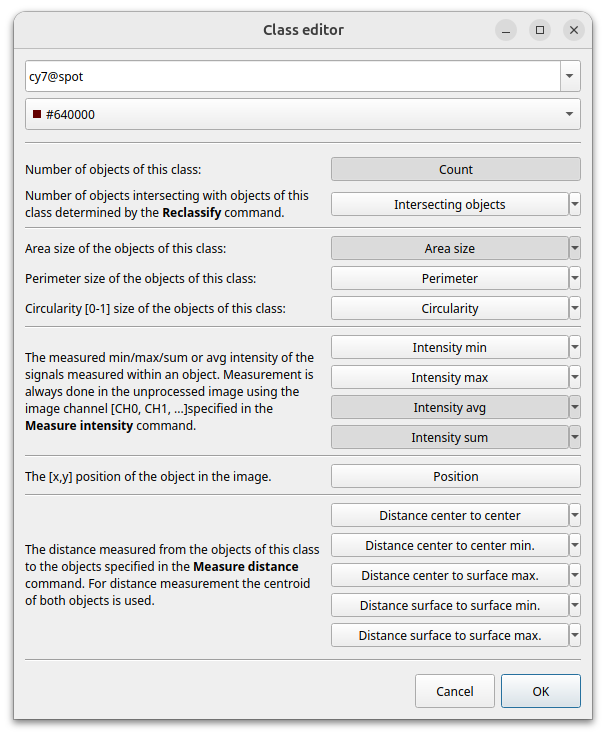
Double click on a class opens the Class editor. The Class Editor is used to define the class name and the color used for all detected objects of this class. In addition the Metrics section allows to define the object metrics to be displayed per default in the results view. However, the measurement settings per object class can be changed at any time without having to rerun the analyses.
Double click on a class opens the pipeline editor. Selected metrics are displayed per default in the results view after the analyses has been finished but can be changed at any time without having to rerun the analyses.
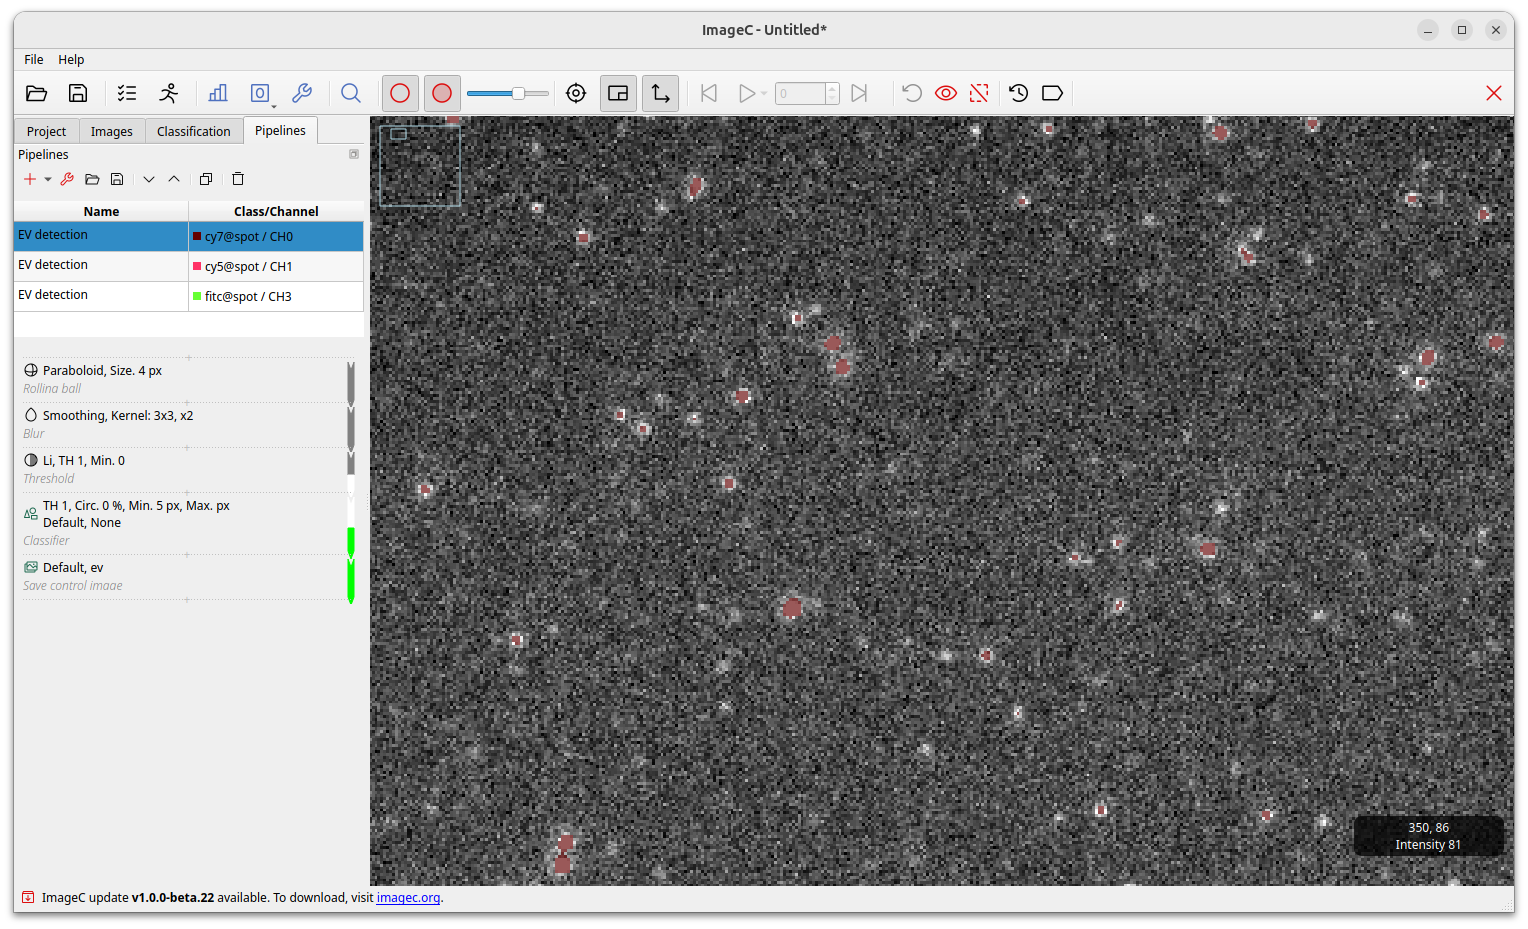
Pipelines
The pipelines tab is used to create image processing pipelines which are used to extract objects of interest from the image channels. ImageC has no limit in the number of pipelines which can be added to a project. During a analyzes ImageC, processes each active pipeline. The optimal processing order and parallel processing of the different pipelines is determined by ImageC automatically based on available CPU cores and possible pipeline dependencies.
By clicking on the arrow beside the Plus button a drop down with predefined analyzing pipelines is opened.
All past EVAnalyzer pipelines are included in this version, marked with the small EV icon to the left.
Select EV channel for loading a pipeline (preprocessing, object filtering, segmentation) optimized for EV quantification from single vesicle imaging images with low background.
Select Cell brightfield for loading a pipeline (preprocessing, object filtering, segmentation) optimized for cell segmentation on brightfield images.
Select Nucleus for loading a pipeline (preprocessing, object filtering, segmentation) optimized for nucleus segmentation after fluorescent labelling of the nuclei (e.g. Hoechst, DAPI).
Select EV in cell for loading a pipeline (preprocessing, object filtering, segmentation) optimized for EV quantification in complex material like cells.
Just press the New pipeline button to start with an empty pipeline.
Bestpractice It is a good practice to add one pipeline for each image channel to extract objects from and one pipeline for each object processing step like Coloc or in cell counting.
By click on a pipeline, the pipeline editor is opened. On the left hand side the input and output options can be defined. The input of a pipeline can either be an image channel or an empty image.
The Pipeline steps box contains all commands which are applied on the input image.
All steps are performed from top to bottom.
Each step can take either an image or a set of objects as input and either an image or a new set of objects as output.
Based on the used command either the image is processed, objects are extracted or objects are processed.
The color bar next to the command indicates the type of command.
Tip See the section Pipeline steps for detailed information about the available pipeline steps and their behavior.
Gray commands manipulate images, white command work on binary images and green commands work on objects. Translation commands translate the output from one input type to an other output type. For example, a threshold command translates an image (grey) into a binary image (white) and an object classification command translates a binary image (white) into objects (green).
A live preview is displayed on the right. It shows the resulting object segmentation after all applied pipelines steps. Changing a parameter will directly change the preview, enabling a fast and easy adjustment and fine-tuning of the settings. A live object count is displayed in the legend of the preview image.
Based on image size and the complexity of the selected preprocessing algorithms it could take a couple of seconds for refreshing the preview. The preview can additionally be zoomed in and out and a second window with the original image and the processed image side by side further enables smooth segmentation setting.
Starting the analysis
After all pipelines are created, the analysis can be started by pressing the Play button on the top.
A dialog box informs you about the progress of the analysis.
At the bottom left of the dialog a Open results folder button is placed.
Press this button to open the file explorer showing the folder with results of the actual analysis run.
With Stop button a running analysis can be interrupted.
It may take a couple of minutes to stop a running analysis since all still in progress tasks have to be finished.
Press the Close button to close the dialog after a successful finished analysis run.