Viewing results
Results from a previous run can be opened by clicking the arrow beside the Open button on the toolbar.
ImageC allows to select which metrics/measurements should be shown.
To add a column click the add column button  .
.
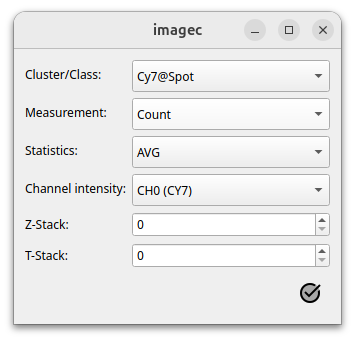
Add a new column
The add column dialog allows to specify which data should be shown. Repeat the process for each data you are interested in. ImageC saves the actual table settings with the database file so that they are restored the next time the results are opened.
Note
See section Results for a complete description of the available metrics.
Plate view
ImageC opens the Plate view panel per default showing an empty table.
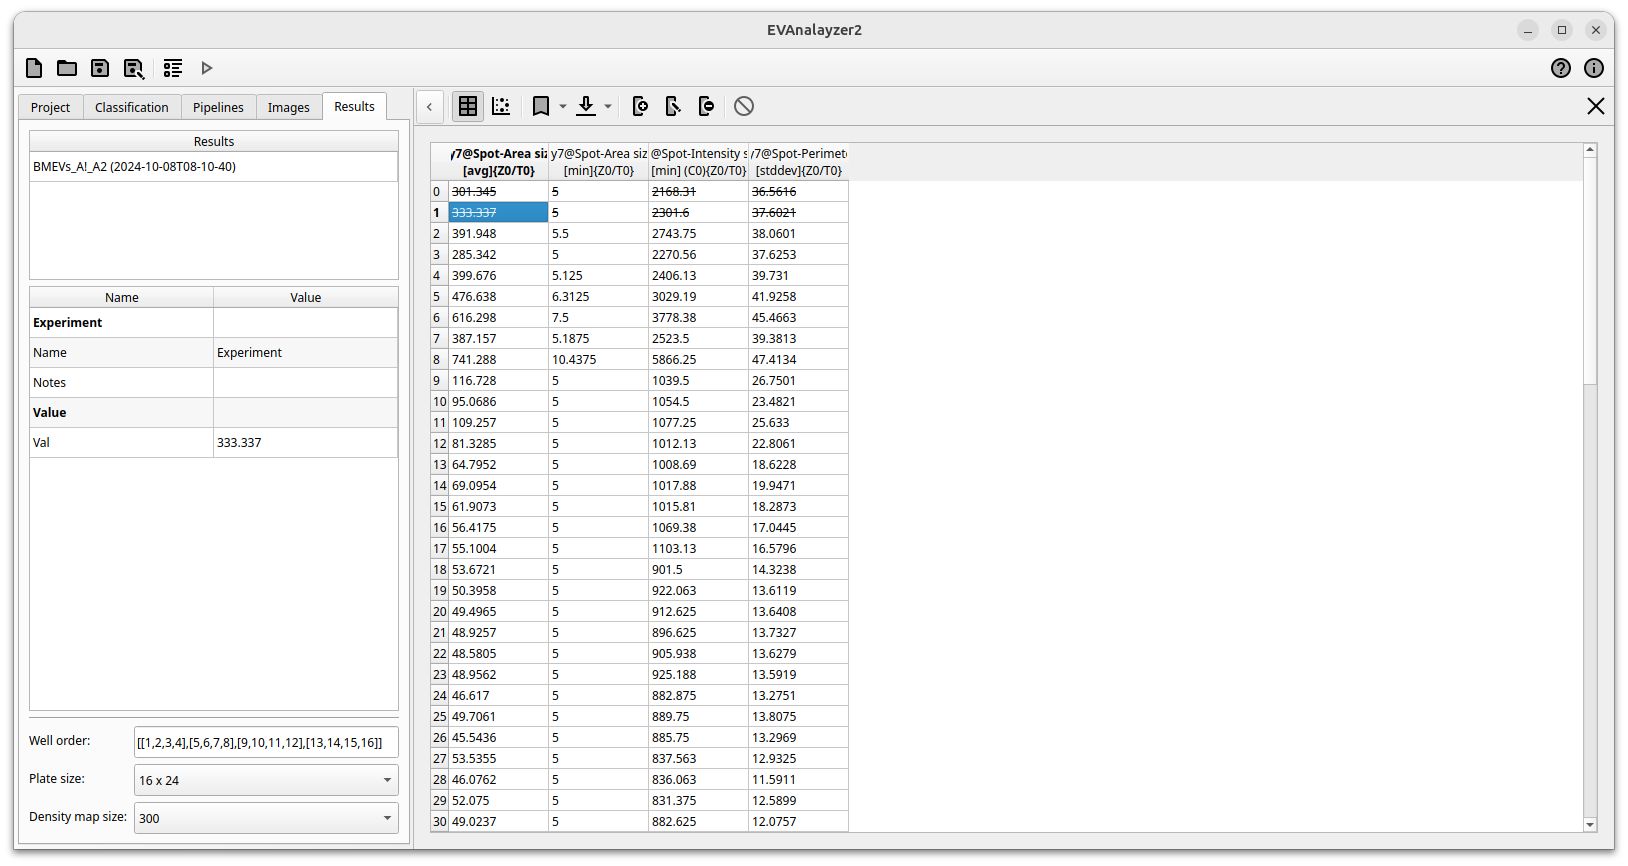
Plate view as table
The plate view displays the Mean values as determined from all individual images taken in the respective well/ group. Image grouping is predefined in Group by settings. If Ungrouped was selected as Group by method, the plate view is not shown and ImageC directly jumps to the image list view.
Using the heatmap button  the view can be switched from a table view to a heatmap view.
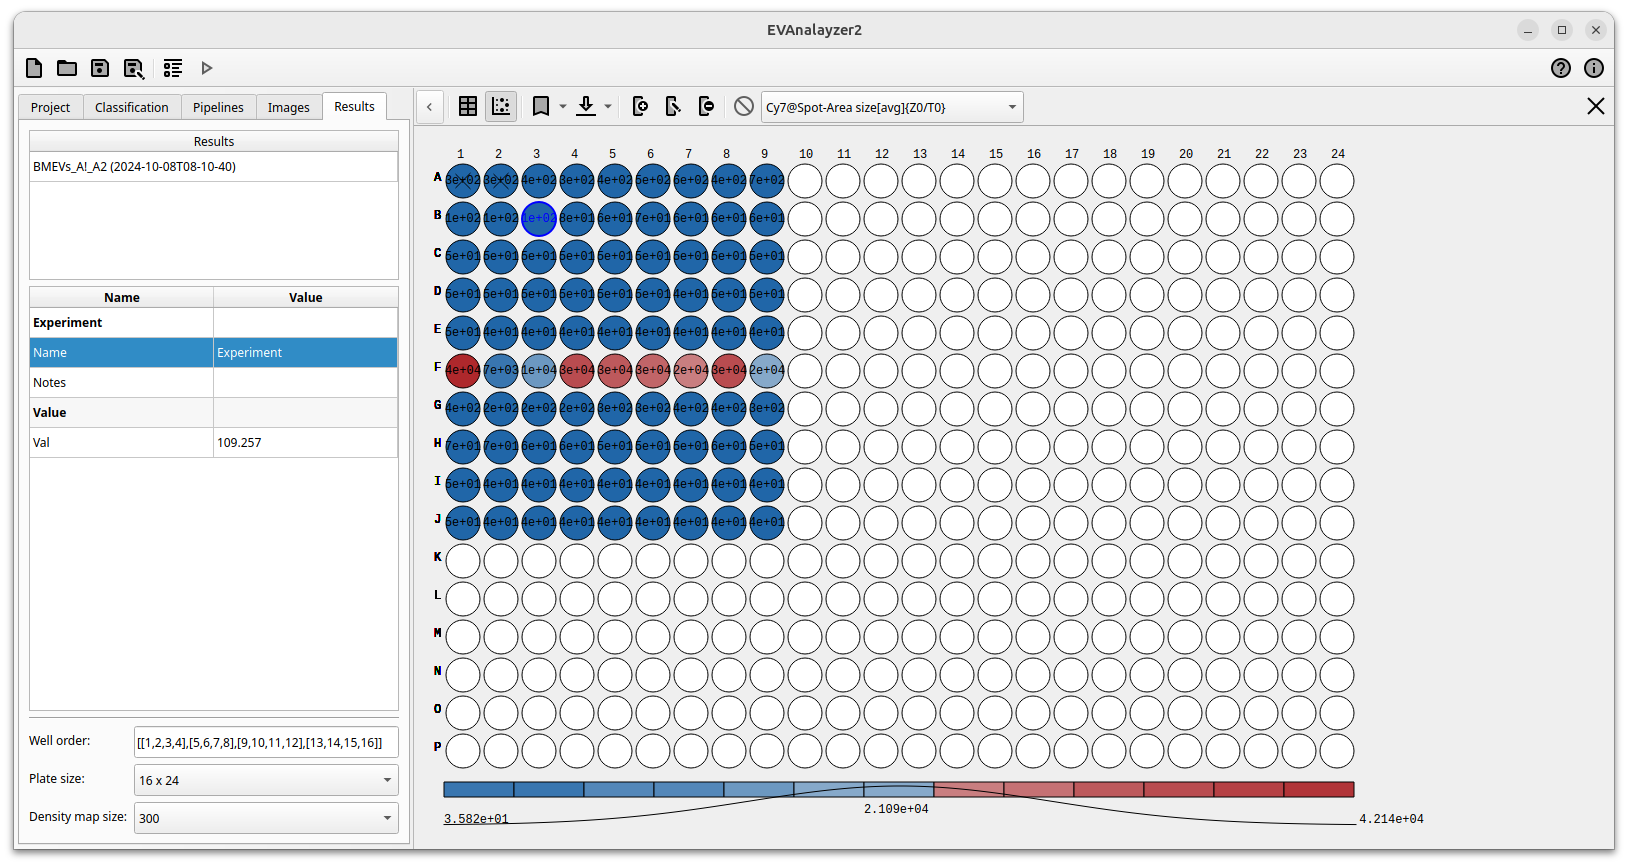
Plate view as heatmap
Wells are coloured using a heatmap calculated from all data displayed, with the mean value of all wells as the centre of the spectrum and the minimum and maximum as the outer left and outer right limits of the spectrum. In heatmap view a dropdown in the toolbar allows to select which column of the table should be displayed as heatmap.
Image view
A double click on a well in the heatmap view or a column in the table view will prompt the opening of a detailed view of the selected well.
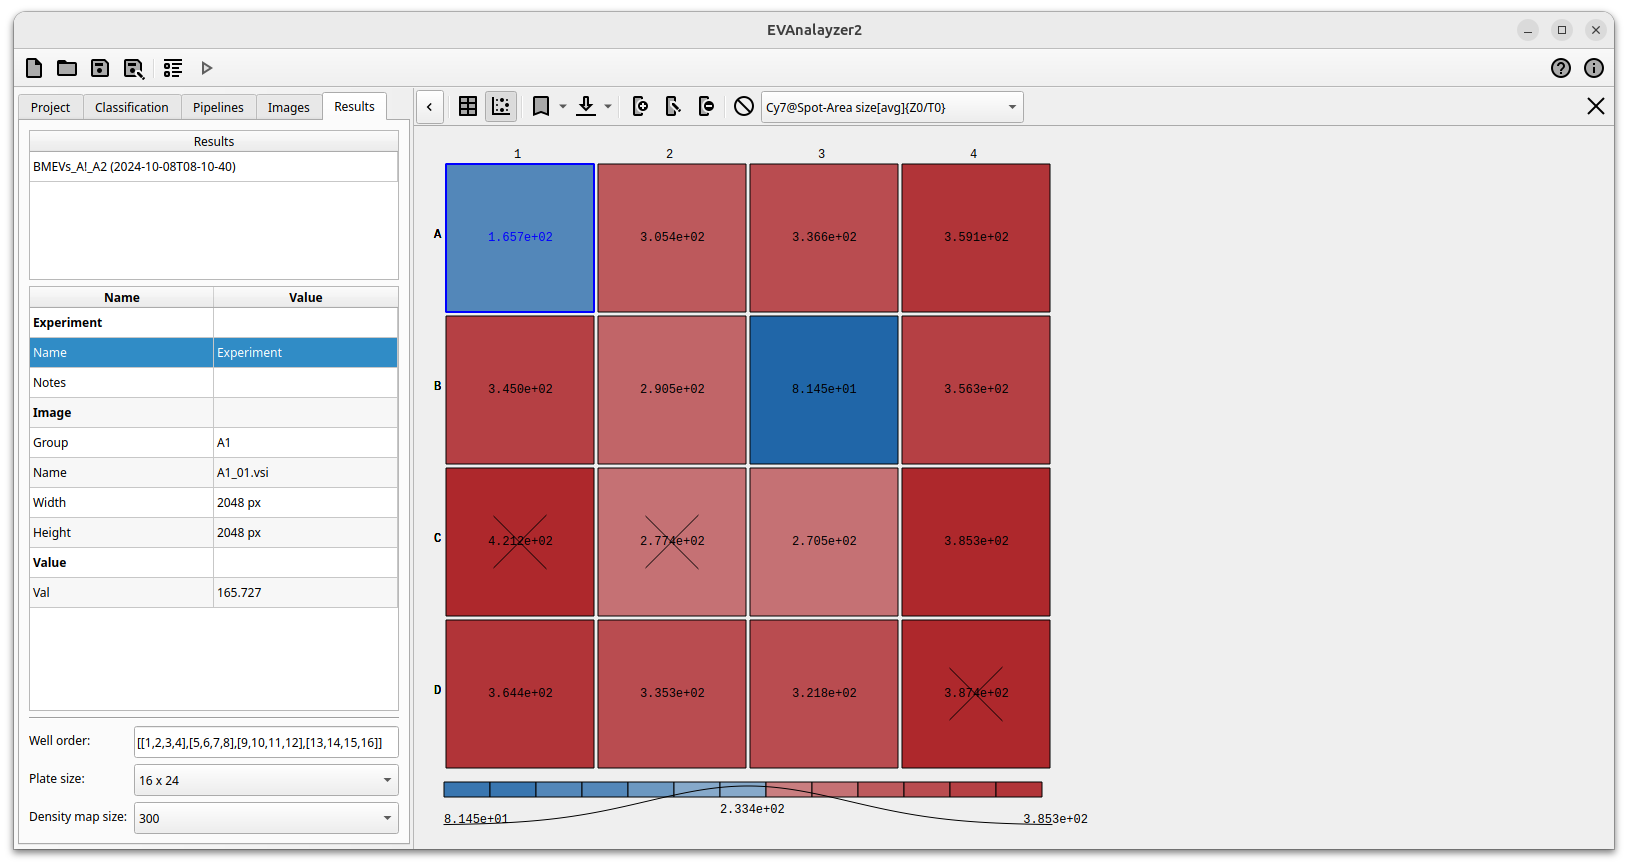
Image view
The Image view displays each image of the well ordered by the image index specified in the Well order matrix. The image index was extracted from the filename during the analysis using the specified regex. To reorder the image position displayed in the well view matrix use the Well order settings field.
If images are to be excluded from the statistics, this can be done via the exclude menu item  .
As invalid marked images are crossed out and are not taken into account in all subsequent calculations.
.
As invalid marked images are crossed out and are not taken into account in all subsequent calculations.
Density map view
To go one step deeper, looking into detail information about a single image, double click on an image in the Image view.
The density view presents a density map of the image. In the bottom left sidebar the are size to b used for calculate the density map can be chosen. ImageC calculates the average value of the selected measurement of all valid objects within this squares.
The square size can be changed using the left hand side panel. Be careful though, if the square size is too small for large images, you may run out of RAM.
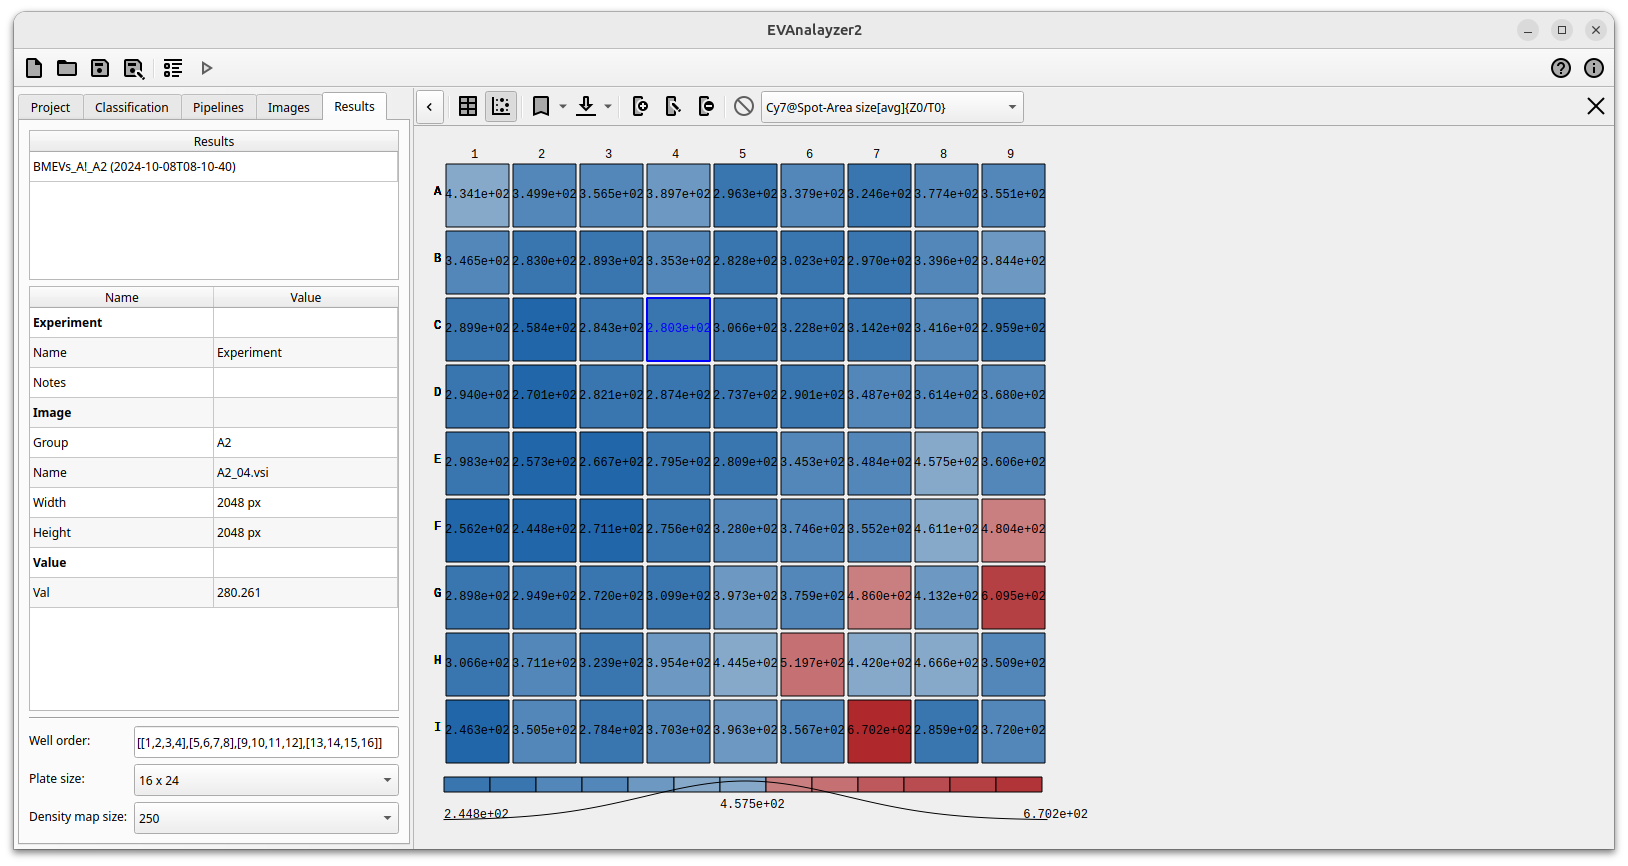
Image view
Data export
The Download button  allows the current settings to be exported as either XLSX or R.