Results
During an analysis run ImageC measures a couple of metrics of each detected object. All the measured data are stored in an in memory SQL database (internally we are using DuckDB). Once the analysis is finished the collected data can be displayed within the ImageC results viewer and either be exported to XLSX or R afterwards.
However, as the number of data generated can be very large, ImageC allows to choose which data to display in the result view. One way to specify the columns to show is using the Results tab before starting the analysis.
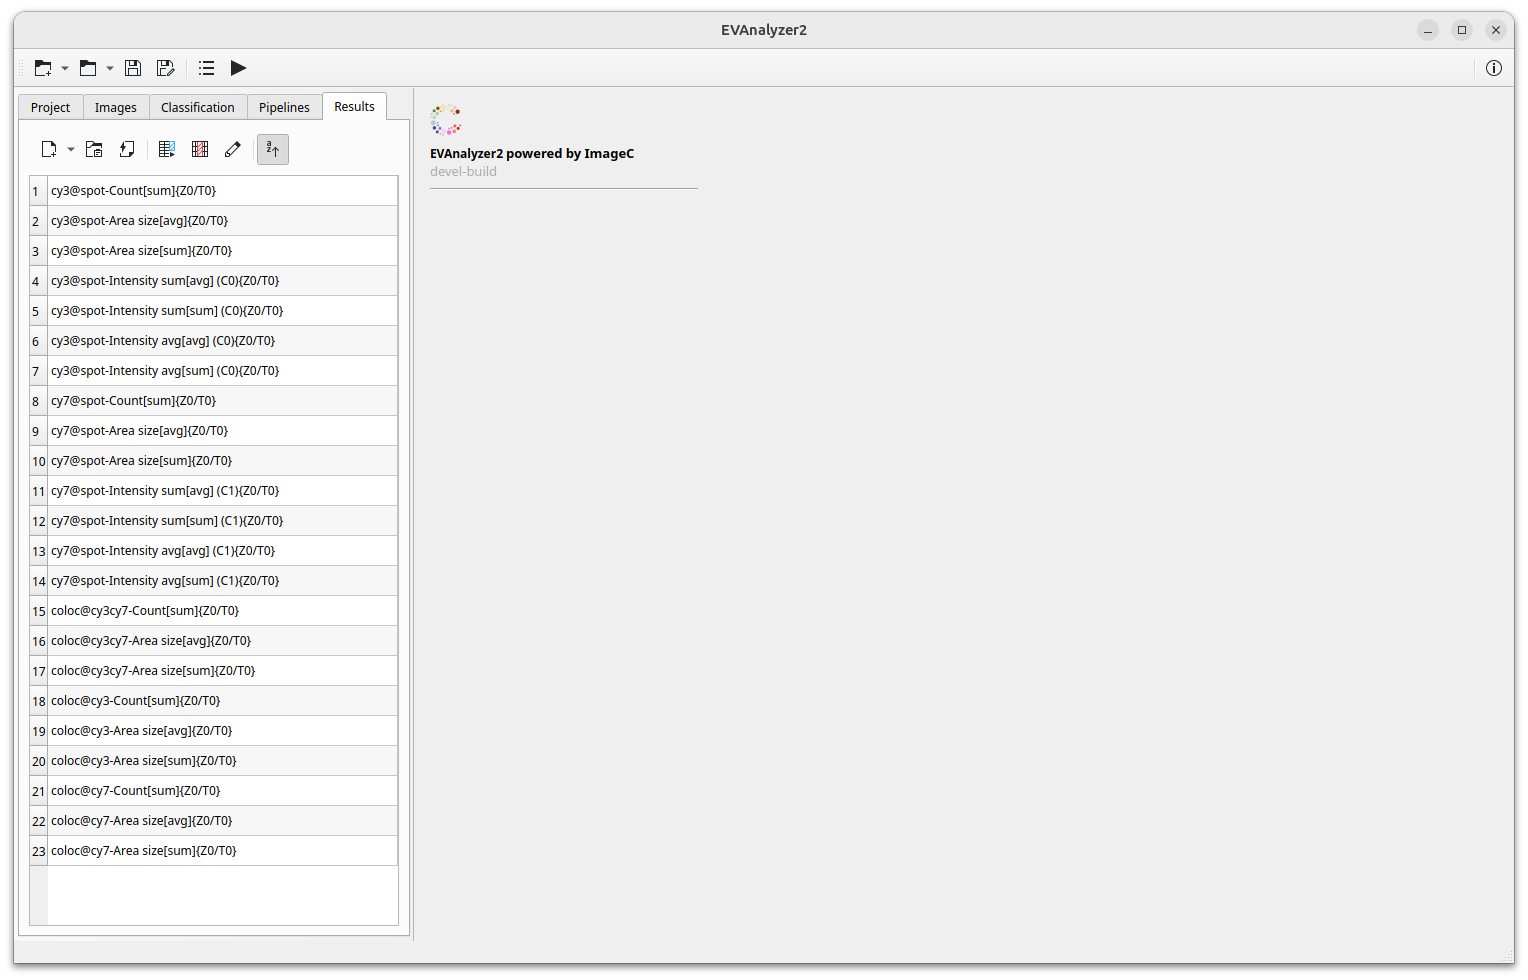
These settings are saved with the project and can be used to define a preset of the desired output data. When the result file is opened after the run, ImageC displays the result columns as specified there.
Even if a column is not specified, the metric is still measured and can be added at any time, even after the analysis has been completed.
Measurements and Statistics
A measurement in the context of ImageC is a metrics calculated during the analysis for an object. The statistics is applied to the selected measurement. The following table gives an overview of the valid combinations of measurements and statistics which are available.
Plate view
Measurement |
Statistics |
Description |
|---|---|---|
Count |
CNT |
The average of the object number per image in the well. |
Intersection |
CNT |
The average of the number of objects A intersecting with object class B per image in the well. |
Area size |
AVG |
The average of the average object area sizes per image in the well. |
Area size |
MEDIAN |
The average of the median of the object area sizes per image in the well. |
Area size |
MIN |
The average of the minimum of the object area sizes per image in the well. |
Area size |
MAX |
The average of the maximum of the object area sizes per image in the well. |
Area size |
STDEV |
The average of the standard deviations of the object area sizes per image in the well. |
Area size |
SUM |
The average of the sum of the object area sizes per image in the well. |
Area size |
CNT |
The average number of objects per image in the well used to calculate the statistics. |
Perimeter |
AVG |
The average of the average object perimeters per image in the well. |
Perimeter |
MEDIAN |
The average of the median of the object perimeters per image in the well. |
Perimeter |
MIN |
The average of the minimum of the object perimeters per image in the well. |
Perimeter |
MAX |
The average of the maximum of the object perimeters per image in the well. |
Perimeter |
STDEV |
The average of the standard deviations of the object perimeters per image in the well. |
Perimeter |
SUM |
The average of the sum of the object perimeters per image in the well. |
Perimeter |
CNT |
The average number of objects per image in the well used to calculate the statistics. |
Circularity |
AVG |
The average of the average object circularities per image in the well. |
Circularity |
MEDIAN |
The average of the median of the object circularities per image in the well. |
Circularity |
MIN |
The average of the minimum of the object circularities per image in the well. |
Circularity |
MAX |
The average of the maximum of the object circularities per image in the well. |
Circularity |
STDEV |
The average of the standard deviations of the object circularities per image in the well. |
Circularity |
SUM |
The average of the sum of the object circularities per image in the well. |
Circularity |
CNT |
The average number of objects per image in the well used to calculate the statistics. |
Intensity |
AVG |
The average of the average object intensities per image in the well. |
Intensity |
MEDIAN |
The average of the median of the object intensities per image in the well. |
Intensity |
MIN |
The average of the minimum of the object intensities per image in the well. |
Intensity |
MAX |
The average of the maximum of the object intensities per image in the well. |
Intensity |
STDEV |
The average of the standard deviations of the object intensities per image in the well. |
Intensity |
SUM |
The average of the sum of the object intensities per image in the well. |
Intensity |
CNT |
The average number of objects per image in the well used to calculate the statistics. |
Center of mass X |
Not practicable in this view. |
|
Center of mass Y |
Not practicable in this view. |
|
Object ID |
Not practicable in this view. |
|
Origin object ID |
Not practicable in this view. |
|
Parent object ID |
Not practicable in this view. |
|
Tracking ID |
Not practicable in this view. |
Well view
Measurement |
Statistics |
Description |
|---|---|---|
Count |
CNT |
The number of detected objects in the image. |
Intersection |
CNT |
The number of objects A intersecting with object class B in the image. |
Area size |
AVG |
The average object area sizes in the image. |
Area size |
MEDIAN |
The median of the object area sizes in the image. |
Area size |
MIN |
The minimum of the object area sizes in the image. |
Area size |
MAX |
The maximum of the object area sizes in the image. |
Area size |
STDEV |
The standard deviations of the object area sizes in the image. |
Area size |
SUM |
The sum of the object area sizes in the image. |
Area size |
CNT |
The number of objects in the image used to calculate the statistics. |
Perimeter |
AVG |
The average object perimeters in the image. |
Perimeter |
MEDIAN |
The median of the object perimeters in the image. |
Perimeter |
MIN |
The minimum of the object perimeters in the image. |
Perimeter |
MAX |
The maximum of the object perimeters in the image. |
Perimeter |
STDEV |
The standard deviations of the object perimeters in the image. |
Perimeter |
SUM |
The sum of the object perimeters in the image. |
Perimeter |
CNT |
The number of objects in the image used to calculate the statistics. |
Circularity |
AVG |
The average object circularities in the image. |
Circularity |
MEDIAN |
The median of the object circularities in the image. |
Circularity |
MIN |
The minimum of the object circularities in the image. |
Circularity |
MAX |
The maximum of the object circularities in the image. |
Circularity |
STDEV |
The standard deviations of the object circularities in the image. |
Circularity |
SUM |
The sum of the object circularities in the image. |
Circularity |
CNT |
The number of objects in the image used to calculate the statistics. |
Intensity |
AVG |
The average object intensities in the image. |
Intensity |
MEDIAN |
The median of the object intensities in the image. |
Intensity |
MIN |
The minimum of the object intensities in the image. |
Intensity |
MAX |
The maximum of the object intensities in the image. |
Intensity |
STDEV |
The standard deviations of the object intensities in the image. |
Intensity |
SUM |
The sum of the object intensities in the image. |
Intensity |
CNT |
The number of objects in the image used to calculate the statistics. |
Center of mass X |
Not practicable in this view. |
|
Center of mass Y |
Not practicable in this view. |
|
Object ID |
Not practicable in this view. |
|
Origin object ID |
Not practicable in this view. |
|
Parent object ID |
Not practicable in this view. |
|
Tracking ID |
Not practicable in this view. |
Image view
Measurement |
Statistics |
Description |
|---|---|---|
Count |
CNT |
Not practicable in this view (always 1). |
Intersection |
CNT |
The number of objects intersecting with this object. |
Area size |
AVG |
The object area size. |
Area size |
MEDIAN |
The object area size. |
Area size |
MIN |
The object area size. |
Area size |
MAX |
The object area size. |
Area size |
STDEV |
The object area size. |
Area size |
SUM |
The object area size. |
Area size |
CNT |
Not practicable in this view (always 1). |
Perimeter |
AVG |
The object perimeters. |
Perimeter |
MEDIAN |
The object perimeters. |
Perimeter |
MIN |
The object perimeters. |
Perimeter |
MAX |
The object perimeters. |
Perimeter |
STDEV |
The object perimeters. |
Perimeter |
SUM |
The object perimeters. |
Perimeter |
CNT |
Not practicable in this view (always 1). |
Circularity |
AVG |
The object circularity. |
Circularity |
MEDIAN |
The object circularity. |
Circularity |
MIN |
The object circularity. |
Circularity |
MAX |
The object circularity. |
Circularity |
STDEV |
The object circularity. |
Circularity |
SUM |
The object circularity. |
Circularity |
CNT |
Not practicable in this view (always 1). |
Intensity |
AVG |
The object (min/max/avg/sum) intensity. |
Intensity |
MEDIAN |
The object (min/max/avg/sum) intensity. |
Intensity |
MIN |
The object (min/max/avg/sum) intensity. |
Intensity |
MAX |
The object (min/max/avg/sum) intensity. |
Intensity |
STDEV |
The object (min/max/avg/sum) intensity. |
Intensity |
SUM |
The object (min/max/avg/sum) intensity. |
Intensity |
CNT |
Not practicable in this view (always 1). |
Center of mass X |
X coordinates of the center of mass of the object in the image. |
|
Center of mass Y |
Y coordinates of the center of mass of the object in the image. |
|
Object ID |
Unique object ID. |
|
Origin object ID |
If it was copied by reclassify this is the Object ID of the object this object was copied from. If not copied the value is 0. |
|
Parent object ID |
If the object was reclassified using intersection, this is the Object ID of the object this object was intersecting with. If not reclassified the value is 0. |
|
Tracking ID |
If the object has been tracked e.g. by coloc or timeframe, all related objects will have the same tracking ID. The table is sorted by Tracking ID. |