First steps
The following tutorial will provide an overview of the fundamental concepts and functions of ImageC, offering guidance on the initial steps required for effective utilization of the software. The tutorial will demonstrate the following:
Creating a new project
Defining classes
Adding pipelines
Starting an analyzes
Open analyzes results
Export results
Analyze images
Note
If you have problems running ImageC see here.
Running ImageC
Once ImageC has been successfully launched, the user will be directed to the start page.
ImageC start screen
The Settings tab on the left is divided into the following sections Project, Classification, Pipeline, Images and Results.
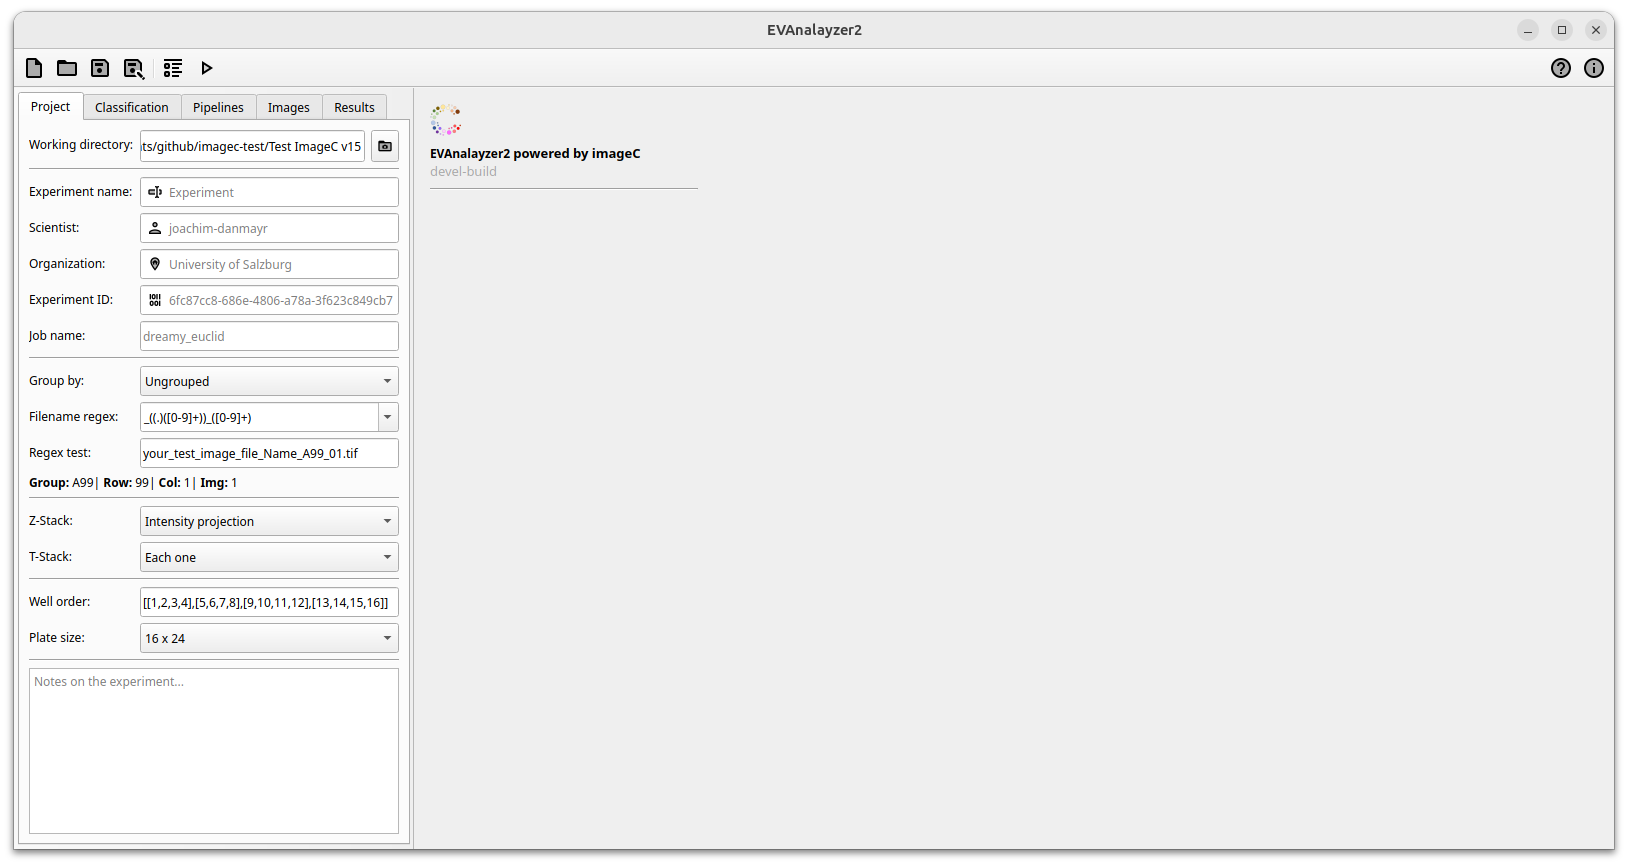
Project tab
Starting with the project settings, basic information about the experiment and the scientist conducting the experiment needs to be collected.
Title |
Description |
… |
|---|---|---|
Working directory |
Storage Directory of the ‘to be analyzed’ images. |
Mandatory |
Experiment name |
Title of the experiment stored together with the results. |
Optional |
Scientist |
Name of the person who is responsible for this analysis. |
Optional |
Organization |
Organization responsible for the analysis. |
Optional |
Experiment ID |
UUID of the experiment to globally identify this experiment. |
Optional |
Job name |
Name of the job to identify the run (auto generated if empty). |
Mandatory* |
Group by |
Images may be left ungrouped, or can be grouped by Filename regex or Directory. |
Mandatory |
Filename regex |
If Images are grouped by filename, the regex should indicate the order of the images: Regex to extract plate row, plate column and image index from the image filename. |
Mandatory |
Regex test |
Used to test the regex settings. Enter your Image Name and see if the wells are recognized. in the regex test result |
|
Z-Stack |
Define how to handle Z-stacks in the images |
Mandatory |
T-Stack |
Define how to handle T-stacks in the images |
Mandatory |
Well order |
If images are taken from in a (6, 12, 24, 96, 384) well format, the order of the images position in the well can be determined here. |
Optional |
Plate size |
Size of the uses microscopy plate. |
Optional |
Notes |
Some free text notes on the experiment. |
Optional |
Caution
Make sure that the grouping options and regex settings are correct, as they are needed for valid image sorting and mean well infos.
It is important to set the correct grouping options in combination with the correct filename regular expression. Based on these settings, ImageC performs assignments of the results during a running analysis. However, if the grouping settings are wrong, these statistics will also be calculated in a wrong way.
When grouping by Foldername or Filename is selected ImageC will calculate the statistics based on the determined group. When opening a analysis result (see dive into the tutorials) these calculated values are loaded for a fluid and fast view.
A change of the grouping settings after analysis is currently not supported by ImageC. If the grouping settings are changed the analysis has to be repeated.
The Working Directory should be set to the folder where the images to be analyzed are stored. ImageC will perform a recursive folder search with the selected Working Directory as the base folder to find all supported image files. All found files are listed in the Images panel.
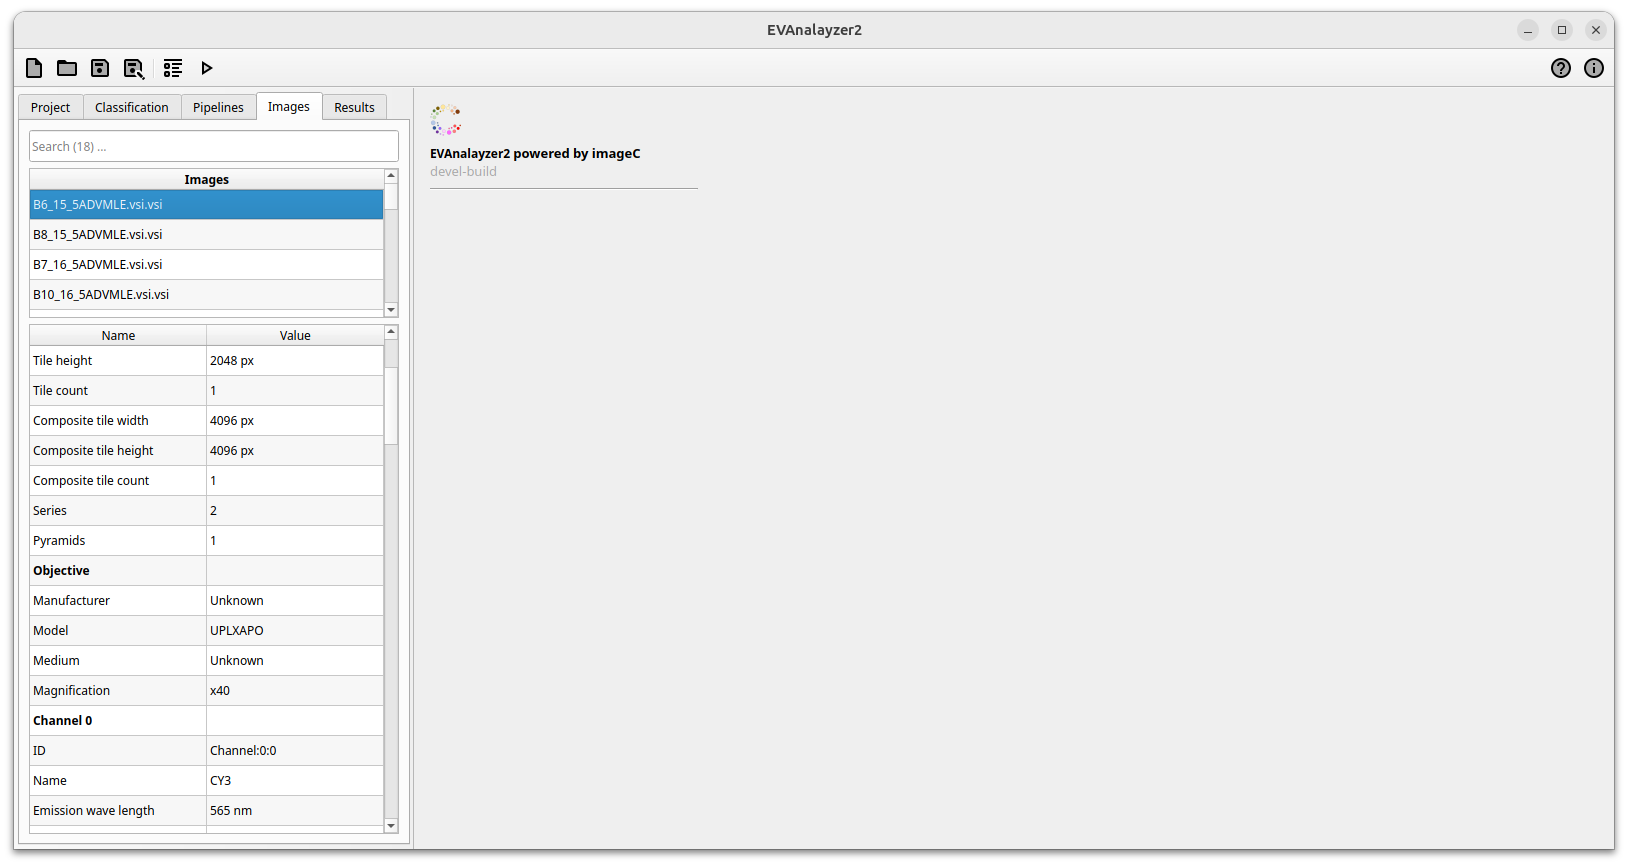
Images tab
Once a working directory has been selected and the folder scan is complete, all the images found will be listed in the table located in the Images tab.
By clicking on an image the OME image information of the selected image is loaded and displayed in the properties table below. The image selected in this tab is also the image used in the pipeline preview.
To the top a search field allows to filter the images in the list against its filename.
ImageC images tab
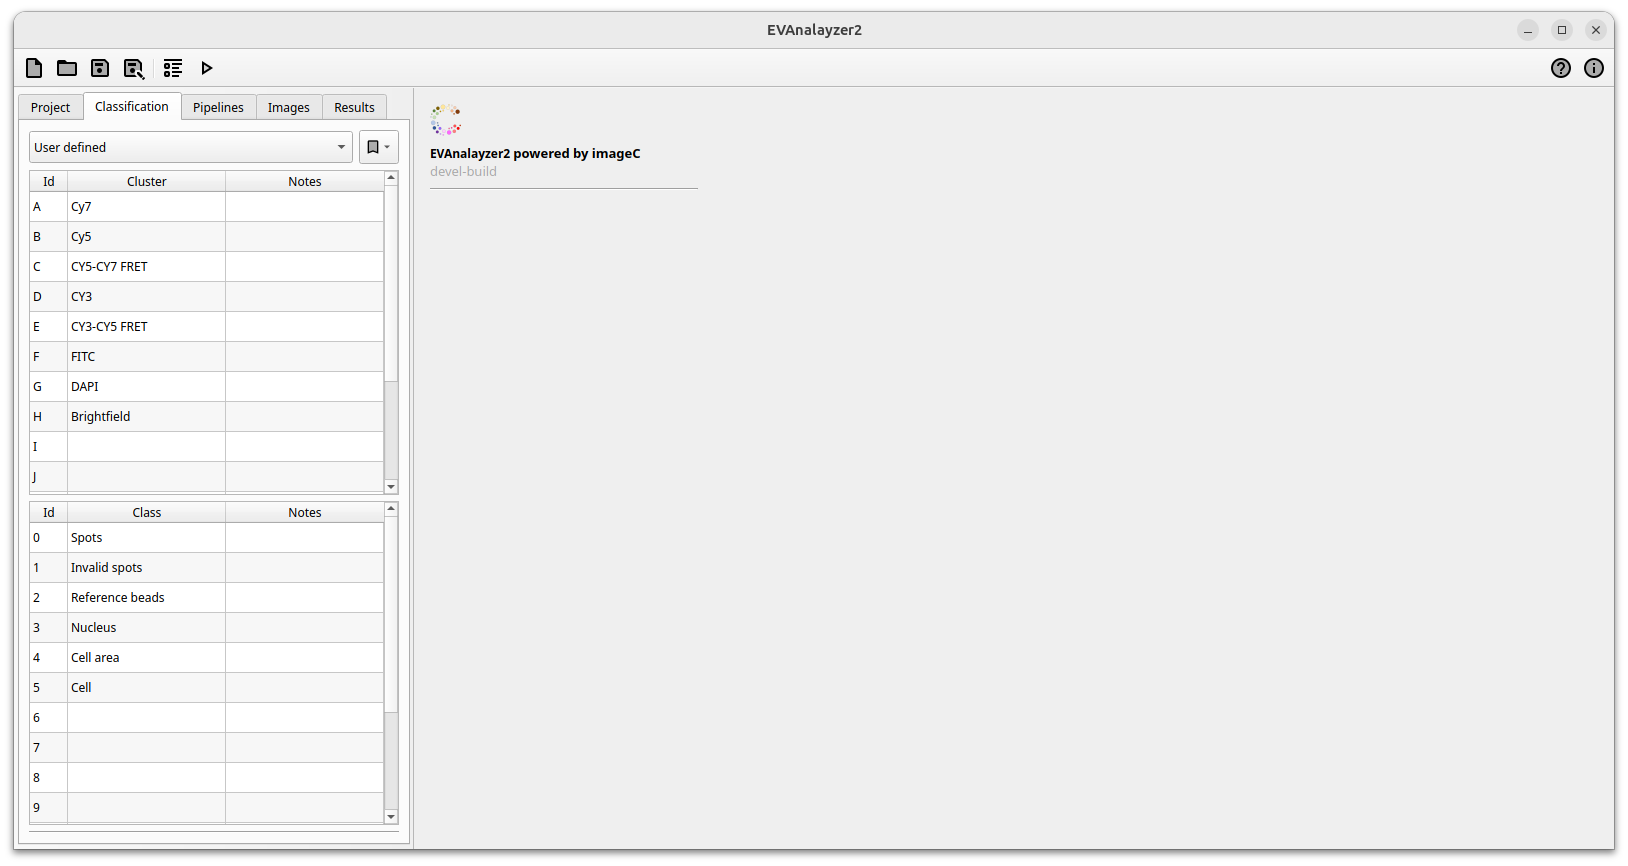
Classification tab
First before creating pipelines and starting the analysis the object classes must be defined.
ImageC classification tab
Classes are used to scope the detected objects needed for a later on statists generation. ImageC allows to either define own classes or to load a preset of classes from a template.
For a quick start the Fluorescence microscopy template can be selected. To edit a loaded preset the option New from template can be used.
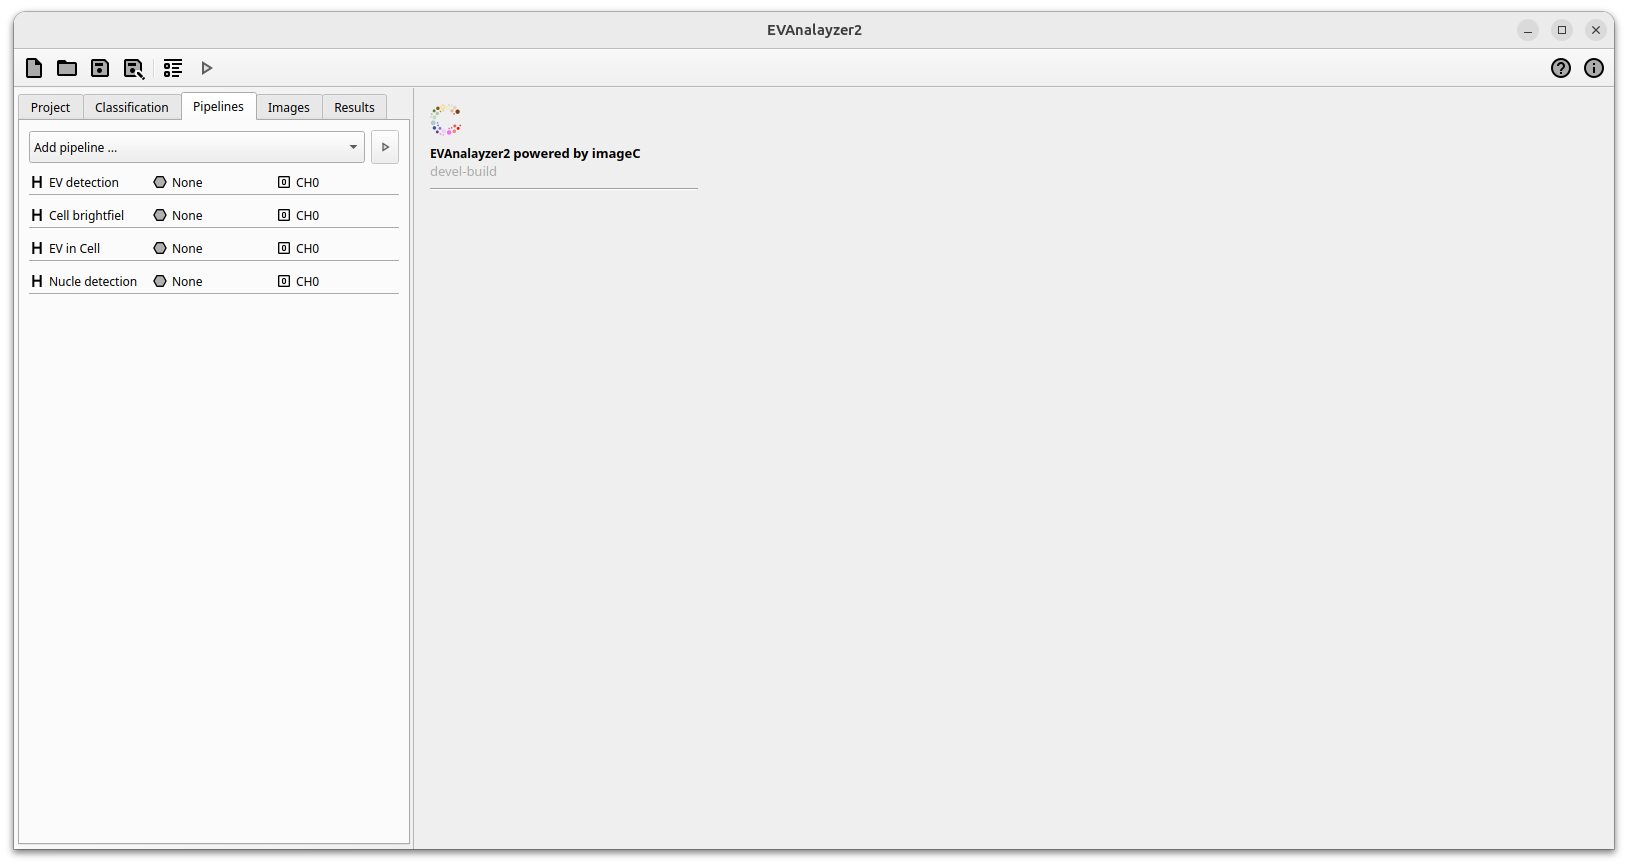
Pipeline tab
Within the pipeline tab the image processing pipelines can be managed. ImageC has no limit in the number of pipelines which can be added to a project. During a analyzes run each pipeline is processed. Pipeline dependencies are automatically resolved by ImageC.
By clicking Add pipeline … a drop down with predefined analyzing pipelines is opened. All past EVAnalyzer pipelines are included in this version, marked with the small EV icon to the left. Select EV channel for loading a pipeline (preprocessing, object filtering, segmentation) optimized for EV quantification from single vesicle imaging images with low background. Select Cell brightfield for loading a pipeline (preprocessing, object filtering, segmentation) optimized for cell segmentation on brightfields images. Select Nucleus for loading a pipeline (preprocessing, object filtering, segmentation) optimized for nucleus segmentation after fluorescent labelling of the nuclei (e.g. Hoechst, DAPI). Select EV in cell for loading a pipeline (preprocessing, object filtering, segmentation) optimized for EV quantification in complex material like cells. Use the Empty pipeline option to start with an empty pipeline.
Setting with one added channel
By clicking on a pipeline, the pipeline editor is opened. On the left hand side the input and output options can be defined. The input of a pipeline can either be an image channel or an empty image.
The Pipeline steps box contains all commands which are applied on the input image. All steps are performed from top to bottom. Each step can take either an image or a set of objects as input and either an image or a new set of objects as output. Based on the used command either the image is processed, objects are extracted or objects are processed. The colour bar next to the command indicates the type of command.
Gray commands manipulate images, white command work on binary images and green commands work on objects. Translation commands translate the output from one input type to an other output type. For example, a threshold command translates an image (grey) into a binary image (white) and an object classification command translates a binary image (white) into objects (green).
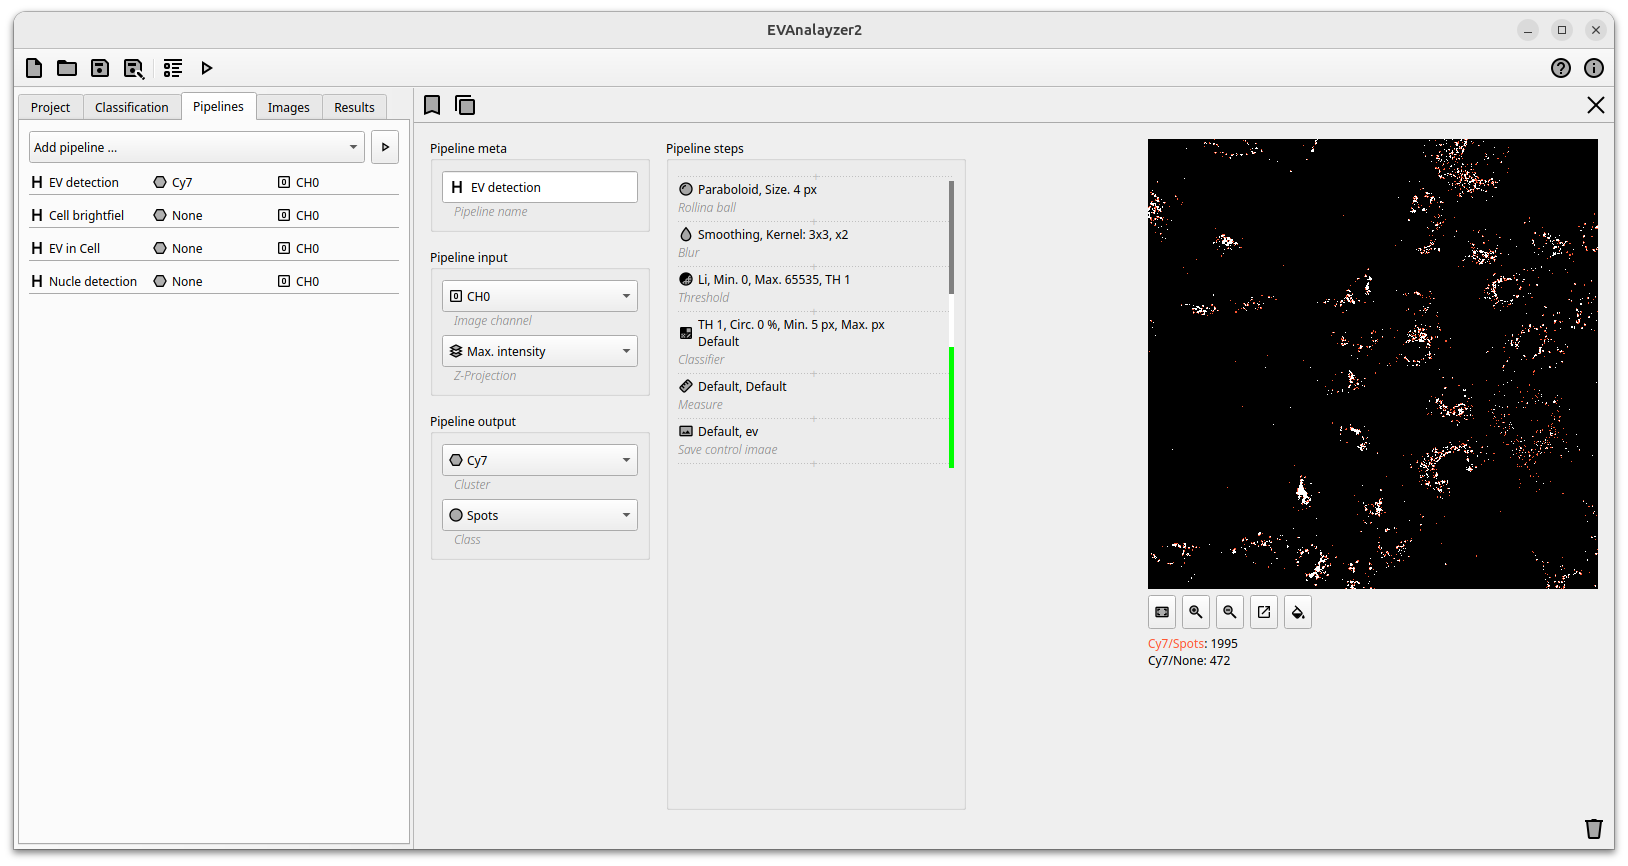
Channel editor
A live preview is displayed on the right. It shows the resulting object segmentation after all applied pipelines steps. Changing a parameter will directly change the preview, enabling a fast and easy adjustment and fine-tuning of the settings. A live object count is displayed at the bottom of the image. Based on image size and the complexity of the selected preprocessing algorithms it could take a couple of seconds for refreshing the preview. The preview can additionally be zoomed in and out and a second window with the original image and the processed image side by side further enables smooth segmentation setting.
Hint
See the section Pipeline steps for detailed information about the available pipeline steps and their behavior.
Starting the analysis
After all pipelines are created, the analysis can be started by pressing the  button on the top.
A dialogue box informs you about the progress of the analysis. At the bottom left of the dialog a Open results folder button is placed. Press this button to open the file explorer showing the folder with results of the actual analysis run.
With Stop button a running analysis can be interrupted. It may take a couple of minutes to stop a running analysis since all still in progress tasks have to be finished.
Press the Close button to close the dialog after a successful finished analysis run.